Increase Your Dredging Knowledge At The End Of The Discharge Line

Keeping watch at the end of the discharge pipe line

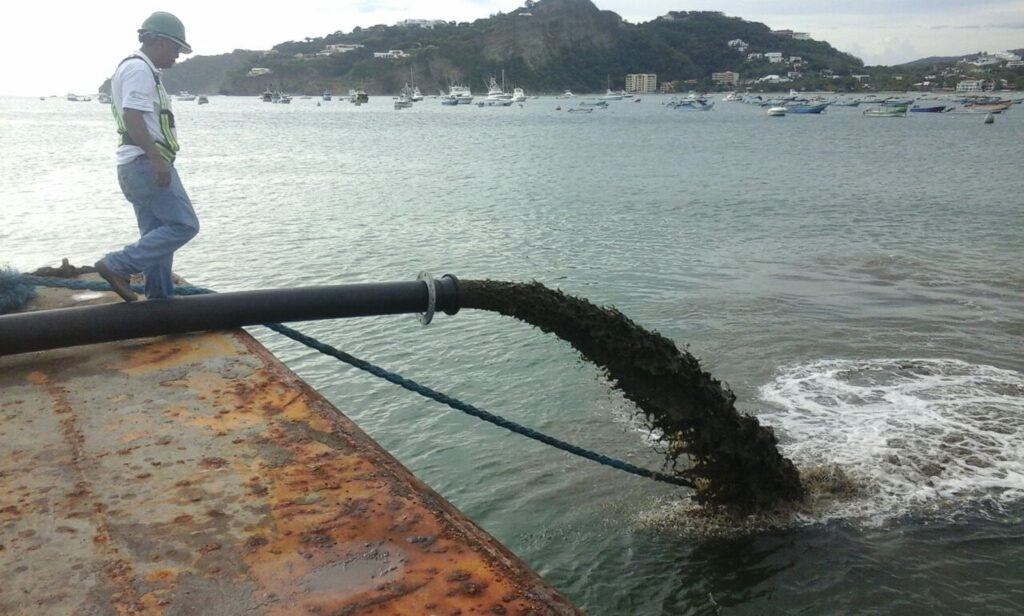
Solving something at the end of the pipe is usually a less desired approach. However, in dredging, it is the place where the valuable stuff is delivered, it might be a good place to start monitoring your process. Let me explain this to you by going back to latest discussed exhibit at the Damen Dredging Experience1.

Pump power exhibit at the Damen Dredging Experience

You might have observed in the pictures of the pump power exhibit, that the velocity of the water flow is indicated by the parabolas of the trajectory. The arc of water is bound by gravity and obeys this trajectory always; independent of the density of the mixture. The two equations of motion can be combined, where the time parameter falls away and the height for a certain distance is only depending on the initial horizontal velocity2. As such, it is fairly accurate indication of the pipe flow. The calculation is universally applicable on earth and the results can be presented in a very simple graph to take with you. Every parabola is labelled with the corresponding horizontal velocity.

Nomogram to find end of pipe velocity

The above example is a straightforward method to measure the mixture velocity. The US Geological Survey even extended this approach as a standard method to measure the production of wells3. The resulting nomogram has a slightly different layout, as it is intended for finding the production instead of the velocity. For production planning, this will be useful. For monitoring your dredging process, the velocity might be more important. Both approaches of this elegant method do have the benefit, that there is no obstruction needed as in the case of an orifice measurement4.

Nomogram to find the end of pipe production

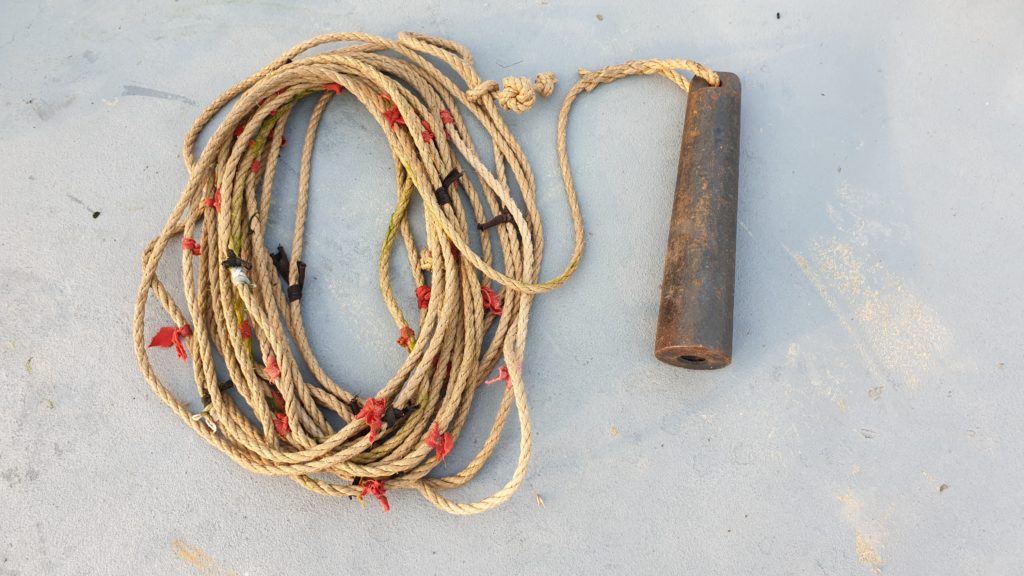
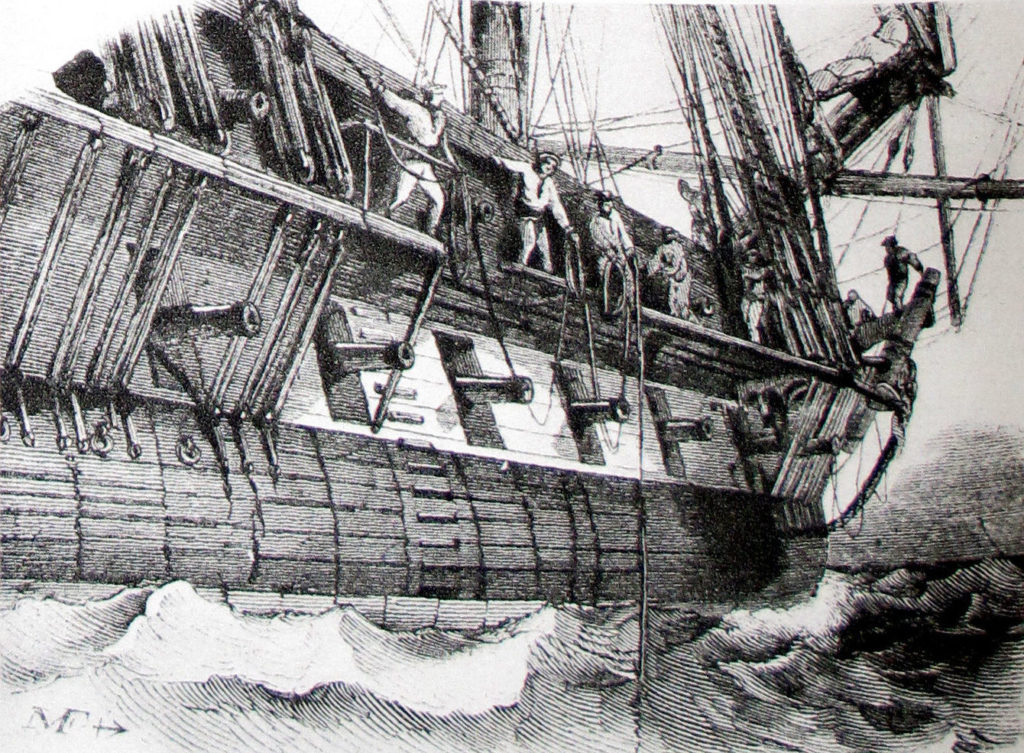
There is an unconfirmed anecdote that my old professor de Koning started his career as a velocity measurer. In the old days, when he was working as a twelve year old boy with the dredging company of his father. He was assigned to keep watch at the end of the pipe and monitor the mixture pouring out. He had a simple beam with a plumb bob. The beam was moved along the top of the pipe, until the plumb bob was touching the arc of mixture. On the beam were two markings. When the beam was moved in and passed the first mark, the mixture velocity was too low and a red warning flag had to be displayed. If the beam had to move out and the mixture velocity was too high at the second mark, a green flag had to be flown. There was also another white flag, in case only water came on the reclamation area. With this very simple setup, the dredge master could check through his binoculars what the state of the dredging process was.

Working principle and explanation of end of pipe meter

They were clever in those days. But the physics still apply. So, even today, one might have a situation, where there is no electronic velocity measurement available (broken, not supplied, not (yet) purchased) and you have to push the limits of the operating envelope of the dredging process. Then, there is probably always somebody around that might be appointed volunteer to be head of the velocity measurement crew. Who knows, he might have a bright future in the dredging academia.

Professor de Koning of the dredging chair at the TU Delft (1981-1993)

References

  1. Presenting Pump Power Peculiarities, Playing With Pumps And Pipes, Discover Dredging
  2. Projectile motion, Wikipedia
  3. Estimating discharge from a pumped well by use of the trajectory free-fall or jet-flow method, US Geological Survey
  4. ISO 5167 Measurement of fluid flow by means of pressure differential devices inserted in circular cross-section conduits running full, ISO

See also

Modern Uses And Legendary Excuses For Manual Depth Sounding

Depth sounding lead and rope

Never waste a moment to tell a good story. Usually, you’ll find informative or educational stories on this platform. This time, I literally found an opportunity to tell you a fun story. All it took, was this nifty little classic navigational instrument. The crew on the dredge used to calibrate their modern survey system1 or checked the delivered depth with this ancient tool. Ever seen one like this? It is a depth sounding lead2. Well, I doubt this one was made from lead, based on the estimated weight and appearance, but it does have all the other characteristics of a normal depth sounding lead.

Evolving from a stone on a rope, the depth sounding lead was used to sound the depth. The plummet was made from lead. The rope was marked at regular intervals according to the shoe size of the current king. Cast overboard, the lead sank and keeping the rope tight, the depth at that location could be read from the markings on the vertical rope. It involved some nimble dexterity to stand at the lee side of a fast moving vessel in a choppy sea to handle the lead, a bundle of coiling rope and accurately reading the depth at the right moment. Hands down to all those seafarers that explored the world in old times and managed to navigate the globe on this instrument.

Sounding the depth manually with rope and lead (Credit: Wikipedia)

The depth was not the only information gained from this action. When you look closely, there is a hole at the bottom of the lead. On the picture above it is empty, but it ought to be filled with grease or wax. When the lead touched the bottom, some of the dirt was caught in the grease. When the lead was retrieved, the cling-ons were inspected. These could be either: sand, mud, gravel, peat, silt or even shells and other biological detritus. The material was reported on the charts also. This made navigation in charted waters easy: compare the sample with the indicated bottom condition. And that brings me to my fun story.

Before the Dutch reclaimed their land, there was a large water body in the Netherlands, called the ‘Zuiderzee’3. Or, South Sea as opposed to the North Sea, which most of you might know. This Zuiderzee, was extensively used for fishing. The skippers did not have charts, but they relied on oral tradition handed down through the ages of where what kind of soil would be available. Near Urk, you might find rocks. Near Pampus, there will be a lot of mud and around Stavoren, there is the famous ‘Vrouwenzand’ (Sand Bank of the Lady of Stavoren4). So, when the fishermen cast their depth sounding leads out, they knew the location of their vessel and the depth beneath it.

Map of the ‘Zuiderzee’ (Credit: Wikipedia)

One of those skippers boasted he did not even have to see and feel the sample, but just by tasting it, he could pinpoint his location within a hundred yards. Hard to believe, right? The cabin boy on board thought likewise. So, he devised a cunning plan. After lunch, the skipper went down to the cabin for a short nap and instructed the cabin boy to bring him the lead to taste the sample. But, our clever cabin boy sank the lead in the crate with potato’s. The bottom of the crate was covered with clay from the potato’s. Carefully bringing the sample to the skipper, the cabin boy woke him up and awaited his reaction. The skipper woke up groggily and grappled for the lead with half closed eyes. He stuck his finger in the sample hole and tasted the material inside. Suddenly, his eyes went wide open and he exclaimed: Oh, disaster! The dikes have broken again! The land is flooded and we are sailing over farmer John’s potato patch!

You never know what you dredge from the bottom of a potato crate

References

  1. Positioning and survey system, Damen
  2. Depth sounding, Wikipedia
  3. Zuiderzee, Wikipedia
  4. Lady of Stavoren

See also

Innovations In The New MAD Series To Increase Uptime And Reduce Fuel Consumption

Innovative Marine Aggregate Dredge for gravel dredging

This week, there will be a lot of interesting presentations at the CEDA Dredging Days 2019 in Rotterdam1. I would like to draw your attention to one particular presentation that I was involved with at certain moments in the project, though not in writing the paper. Kudos to my colleagues Frank & Frank to write the interesting manuscript2.

The topic of the presentation will be the change of perspective for the concept of marine aggregate dredging. Historically, the marine aggregate dredging takes place relatively close to shore. With the depletion of the deposits and the increase in demand, other locations further out at sea are coming into focus. As Damen, with a heritage in the design of offshore operating vessels, it was a natural choice to cross breed the offshore supply vessels with the marine aggregate dredges. The resulting offspring: the MAD series of hopper dredges3. Frank de Hoogh will elaborate on the seakeeping abilities of this innovative design.

Other dredging related innovations are the suction tube and ancillary equipment, the screening towers and the process sensors. Of those, I have some personal anecdotes on the screening towers and the density sensor. For all other interesting stories, you’ll have to attend the presentation.

The screening towers are fundamental to the efficiency of the process. If the screening is improved, shorter dredge cycles are possible and a better product can be landed onshore. Also, if the requirement for the product change, the screens have to be adapted to the new specifications. Ideally, this changing has to be done at one unloading phase, otherwise you miss a complete dredge cycle. A lot of effort has been done to optimise the design. But the real test was to actually build, modify and test the complete screening tower, before it was even installed on the vessel. So, we had this construction right here at our doorstep for a thorough evaluation.

Screening towers for fit and fat testing at our yard

One other component, that I was even more involved with, was the non-radioactive density sensor. There are regulations in place to phase out nuclear density sensors4 and a lot of alternatives are available. Back in the !VAMOS! project5, we had the opportunity to test a unit of an electro tomography system. The results indicated a good reliability and a worthy replacement for the traditional nuclear sensor6. Because of the tomography picture, there was an additional benefit: we received an early warning on the slurry behaviour. We could actually see when we were too close to the deposition limit in the pipe line. This enabled us to work with higher densities at lower velocities, resulting in better efficiency and less wear. As the rough process conditions in the mining pit were similar to the marine aggregate dredging industry, we proposed to use this on this MAD also. How we further developed and tested this system is for you to hear and see at the presentation.

Testing the non-radioactive density sensor

Due to the physical processes involved in slurry transport, the mixture does not behave like a normal Newtonian fluid. It is some non-linear viscous substance. At high speeds and low concentrations, it is similar to the carrier water. Slowing down, there is a certain critical speed, where there is a minimum hydraulic gradient. At that flow condition, the specific power consumption of moving a cubic meter of soil is the lowest. So, although working at critical speed is dangerous, it has its advantages: low fuel consumption and less wear. Actually seeing the mixture approaching this critical speed from the deposition is an interesting feature of this new density measuring sensor.

Explanation on slurry flow conditions, critical speed and specific power consumption

References

  1. CEDA Dredging Days 2019, CEDA
  2. Next generation marine aggregate dredger as platform for innovation and basis for fleet renewal, CEDA
  3. Damen unveils Marine Aggregate Dredger, Damen
  4. Regeling bekendmaking rechtvaardiging gebruik van ioniserende straling, Staatscourant
  5. Project ¡VAMOS! Let’s Go Real!
  6. Real time production efficiency based on combination of non-nuclear density and magnetic flow instrumentation, WEDA

See also