Student Interviews On Their Projects With Our Dredge Pump Slurry Test Circuit In Damen Nieuws

Damen dredge pump slurry test circuit on the outfitting quay in Nijkerk

‘What sets men apart from boys is the size of their toys.’ And that wisdom applies to a lot of students that we’ve had at our company and have grown from boy to man working on our dredge pump slurry test circuit for their internship or graduation. As the test circuit has seen some intense activity these last months and yielded us with some very innovative concepts and possible new products, it was the right time to cover this interesting piece of equipment in the internal Damen Nieuws1 of January 2021 to share with all our colleagues. And that occasion in turn is an excellent opportunity to share with you the article and zoom into some of the details of the circuit.

General arrangement of the dredge pump slurry test circuit

Already more than ten years ago, we felt the need to have our own testing facility to experiment with the processes in our dredges or check the performance of new products2. After defining the specifications of the circuit, we had Hylke Visscher assisting us in designing the circuit for his internship. Subsequently he could actually supervise the manufacturing of the circuit for his graduation. Hylke worked in close cooperation with Arjan de Vries who in turn did his graduation on the building, outfitting and commissioning of the circuit. Both students from then are now esteemed and valuable colleagues as we have appreciated their performance on their projects.

After those ten years, we have a new generation of students working on the circuit. Arend van Roon recently graduated on his project with the circuit, as covered in my last post3. Currently Wim Kleermaker is preparing his experiments on the dredge pump. Upcoming is Williem Salim, not yet mentioned in the article, but now already starting his internship on the instrumentation of our laboratory. All project on the test circuit are supervised by Pieter van der Kooi as plant manager, Frank Bosman as student coordinator. Depending on the project, Ewout van Duursen, Suman Sapkota and me are supervising the student projects more on a subject level.

Various executions of a U-bend c-meter in the test circuit, for delivery and installed on a dredge

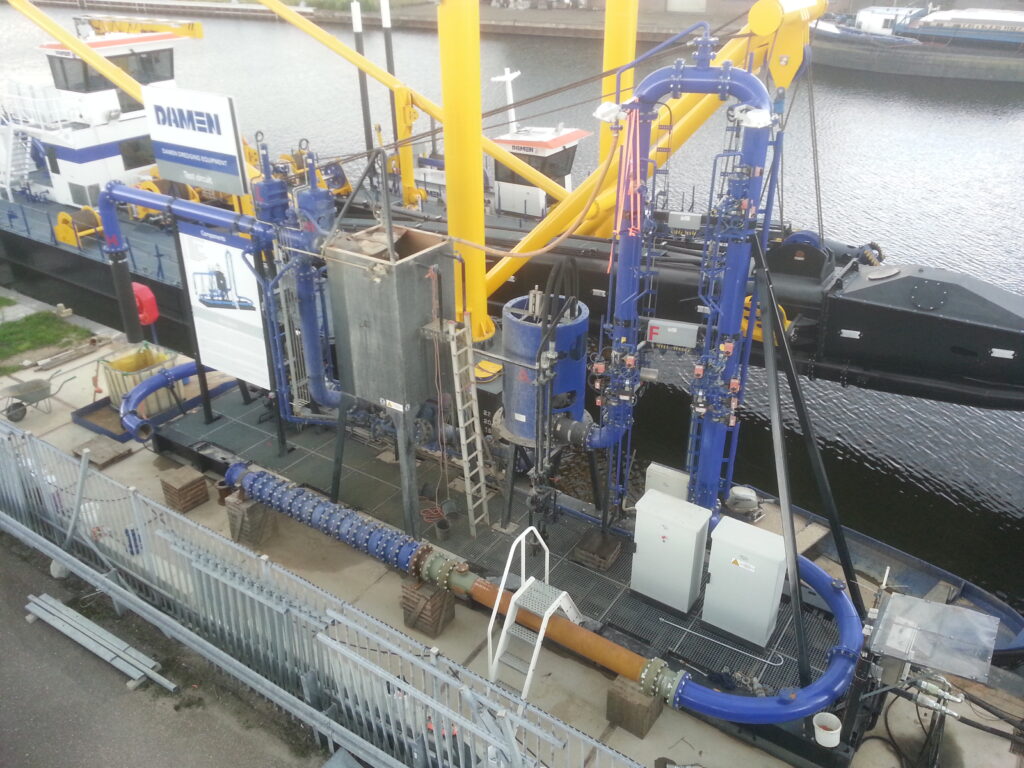
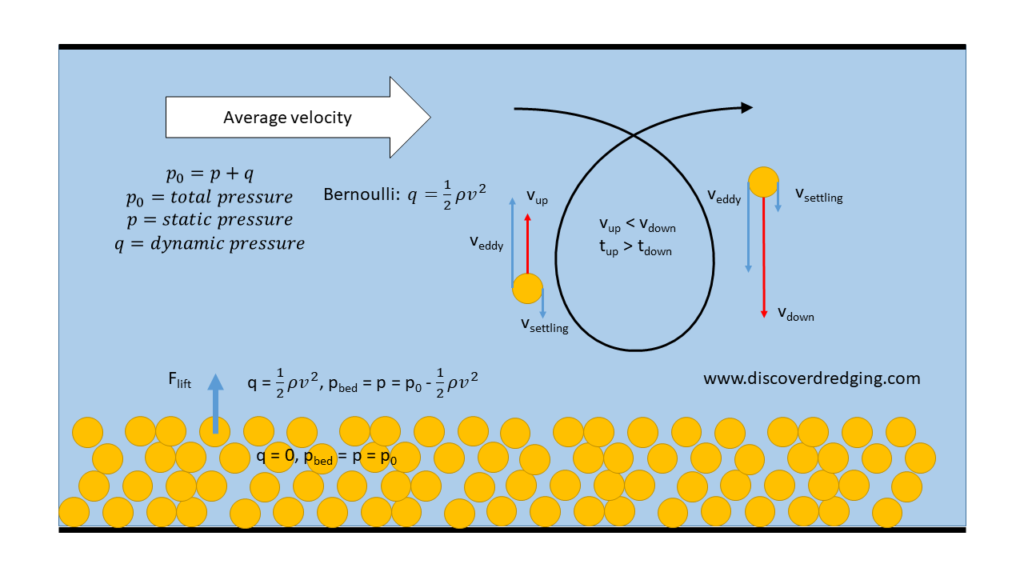
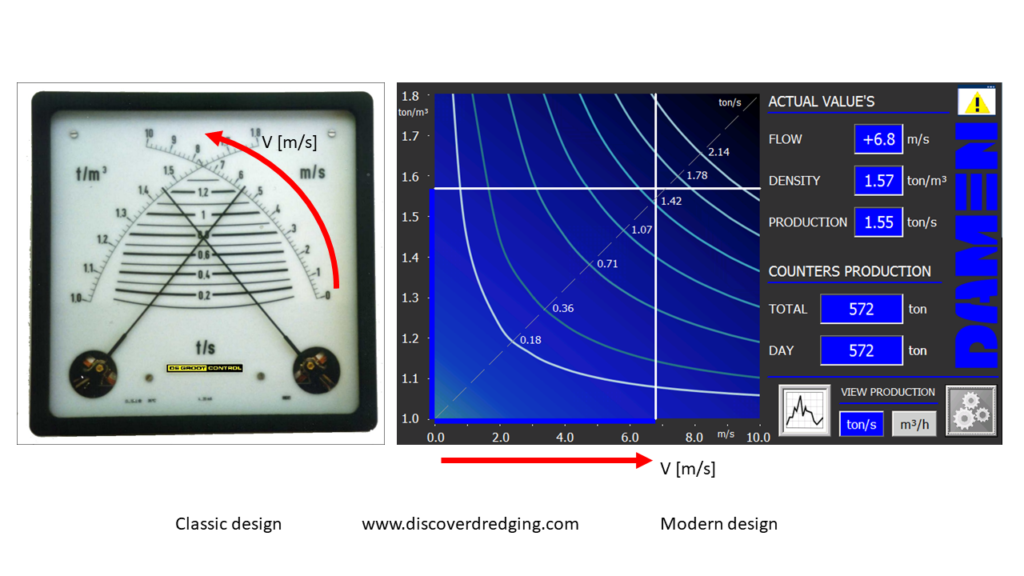
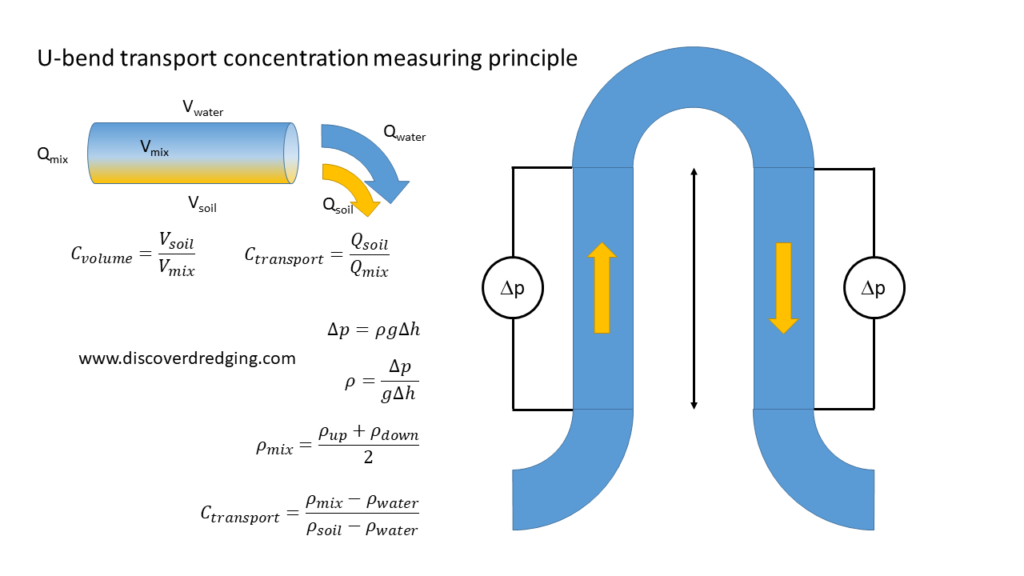
The odd thing you might notice in the loop of the test circuit is the U-bend directly after the dredge pump. Contrary to most first impressions, it is not to generate resistance, although it does so slightly. It is to measure how much sand has been transported. As the circuit is by nature closed, there is no way to check how much we’ve transported through the dredge pump. Sure, there is a density sensor4, but this will only indicate the so called volumetric density; how much material is there in the cross section. It will not differentiate between fast moving slurry and a slow sliding bed. In the extreme you could have a static bed, indicating a very high concentration. Multiplying this with a very high fluid speed, that is squeezed through the remaining aperture, you would expect an impressive production. Wrong! Not a single particle gets transported.

Enter: the U-bend. It measures the hydrostatic pressure differences over a certain hight in the upstream and downstream branches. This will cancel out the velocity differences but will yield the actual transported mass flow. So, that is how we can claim that we already dredged millions of cubic meters, all on the floor area of a 40 foot container flatbed.

Explanation of the U-bend measuring principle

References

  1. Testcircuit, Damen
  2. Innovation, Damen
  3. Graduation of Arend van Roon: Detecting Flow Regime And Optimising Transport Efficiency, Discover Dredging
  4. Production management, Damen

See also

Graduation of Arend van Roon: Detecting Flow Regime And Optimising Transport Efficiency

Arend van Roon defending his graduation thesis

Our first happy event this year is the graduation of Arend van Roon. He recently graduated on a project in the slurry test circuit at our Research and Development department at Damen Dredging Equipment1. His research was an interesting investigation in the detection of flow regimes. It gives some insight in the processes involved in the transport of water-solids mixtures. Let me share some details from the background with you, as I think this might be helpful for your own operation also.

Overview of the Damen Dredging Equipment slurry pumping test circuit

At first sight, it is hard to imagine, how something heavier than water, the grains, can be lifted when the fluid is moving. Sape Miedema has written the standard on mixture transport in his book ‘Slurry Transport’, explaining his approach with the ‘Delft Head Loss & Limit Deposit Velocity Framework2’. Without going into the academic details, I will try to help you grasp the gist of the phenomena.

DHLLDV book (Credit: Sape Miedema)
Slurry Transport text book cover (Credit: Sape Miedema)

First the grains have to be picked up. When they are lying on the bottom of the pipe, they are fully immersed, surrounded by the fluid on all sides. The free fluid on top and the pore water between the grains under and on the side of the grains. Now comes Bernoulli’s trick. When the fluid in the pipe starts moving, he says that the local dynamic pressure decreases, while the static fluid in the pores remains at the same pressure. The pressure difference between the pressure in the pores and in the moving fluid, pushes the grains out of the bed into the fluid.

Grain pickup and suspension process explained

Once the particles are in the fluid are in the fluid, they should stay suspended, or they fall back into the bed. The driving force here is the turbulence in the fluid. Usually dredging slurry mixtures are turbulent. This turbulence causes the fluid to flow in eddies. These are little vortices that generally move in the direction of the flow, but in a moving frame of reference tumble in all directions. Mmh, as they rotate in all directions, why don’t they cancel each other out? Now, imagine being a particle yourself, surfing on those eddies. When it is in a fluid, it tends to sink with a certain settling velocity. Independent of the local movement of the fluid. This means, that on the downward side of the eddy, the particle has a higher total velocity than on the upward side. As the eddy is sort of symmetric, the particle dwells longer in the upward draft than on the downward fall. In this infinitesimal time difference, the eddy transfers some extra kinetic energy from the fluid to the potential energy of the particle. As this loss of kinetic energy is compensated by an increase in pressure (remember Bernoulli) carrying grains in a fluid increases the pressure loss in the slurry transport.

Flow regimes and excess hydraulic gradient requirements in dredging slurry transport (Credit: Sape Miedema)

This turbulence is in short the background of suspension in the slurry transport process. Depending on al the various governing parameters: densities, viscosity, diameters, velocities etc, the equilibrium of forces result in several different regimes in the slurry flow. Ranging from homogeneous, through stratified to ultimately a static bed. Each with their own particular pressure losses. And that is what we are interested in. On our dredges, we want to transport as much material to the least amount of energy3. We are constantly looking for improvements in our equipment and sensors to assist the operator in visualising and controlling the actual state of his process4. Thanks to Arend’s project and the promising results, we can set the next step in our product development.

Explanation on slurry flow conditions, critical speed and specific power consumption

References

  1. Innovation, Damen
  2. Slurry Transport: Fundamentals, A Historical Overview & The Delft Head Loss & Limit Deposit Velocity Framework 2nd Edition, TU Delft
  3. Innovations In The New MAD Series To Increase Uptime And Reduce Fuel Consumption, Discover Dredging
  4. Dredging Instrumentation, Damen

See also

Sensible Flow Sensing Stories, The Correct Capacity Measurement

Example of a flow meter on a Cutter Suction Dredge

My last posting was a nice story about how they measured mixture velocity in the old days1. Luckily, we have a much better solution nowadays: the electromagnetic flux flow meter2. It is real time and can be viewed from the convenience of the operating cabin. This device can be part of the production measurement for a CSD, TSHD or sometimes in a separate production measurement unit.

Combined velocity and density indicator in the operating cabin

The working principle of an electromagnetic flux flow meter is based on the Faraday laws of induction3. When a conductor moves through a magnetic field, a current will flow in the third direction perpendicular to both. Due to the resistance of the water, the resulting potential can be picked up by electrodes that are in contact with the mixture.

Explanation of the electromagnetic flux flow meter

For the principle to work, the electrodes and the mixture have to be isolated from the housing. This is why you always have some isolating liner in this type of flow meters. Off course, the isolation material will wear down due to the abrasion of the mixture. Usually when working in relatively soft sediments, the isolation liner is made of durable polyurethane rubber. The electrodes are flush with the surface of the liner and are not much exposed to wear. When the liner is worn down, it can be easily replaced by the supplier. When working in a more abrasive environment, a more durable isolation liner can be chosen. e.g. Ceramic tiles embedded in a soft adhesive layer.

Arrangement of an electromagnetic flux flow meter

The measured voltage gets processed by an amplifier that has to be placed close by. The outgoing signal is mostly the usual 4-20mA and can be transmitted directly to a velocity indicator or a production indicator. Sure, it is good to have a high velocity, as that represents a good production. But it is also indicating a high power consumption. One is more sensible to increase the mixture density and decrease the velocity for an efficient production. To monitor the dredge process, both signals can be combined in a single indicator to present the production to the operator.

Example of different executions of production indicators

The left example is the classic ‘mechanical’ cross-needle indicator. Where the needles intersect, the production can be read on the lines between the scales. On the right, the rotating needles have been replaced by digital linear scales. The velocity is represented horizontally and the density vertically. Consequently, the production lines are also modified. Instead of a high production vertically in the centre, the highest production is now in the upper right corner.

These flow sensors are quite accurate and are reliably indicating the correct value. Still, it is good practice to check the indicated flows, after installation. This calibration can be done for one or two points. The easiest check point is with static water. The other point will be with some known flow. If the installation is on a TSHD, it is straightforward to fill the hopper. Be aware, that the flow has to be integrated over the filling time. For a CSD type application we may have to resort to the described end of pipe indicator from previous post. And if the values are off, erratic or otherwise not making sense, you might have to check whether the housing of the sensor is correctly grounded to both other flanges.

Ungrounded and correctly grounded housing of a flow sensor

References

  1. Increase Your Dredging Knowledge At The End Of The Discharge Line, Discover Dredging
  2. Magnetic flow meter, Wikipedia
  3. Faraday’s law of induction, Wikipedia

See also