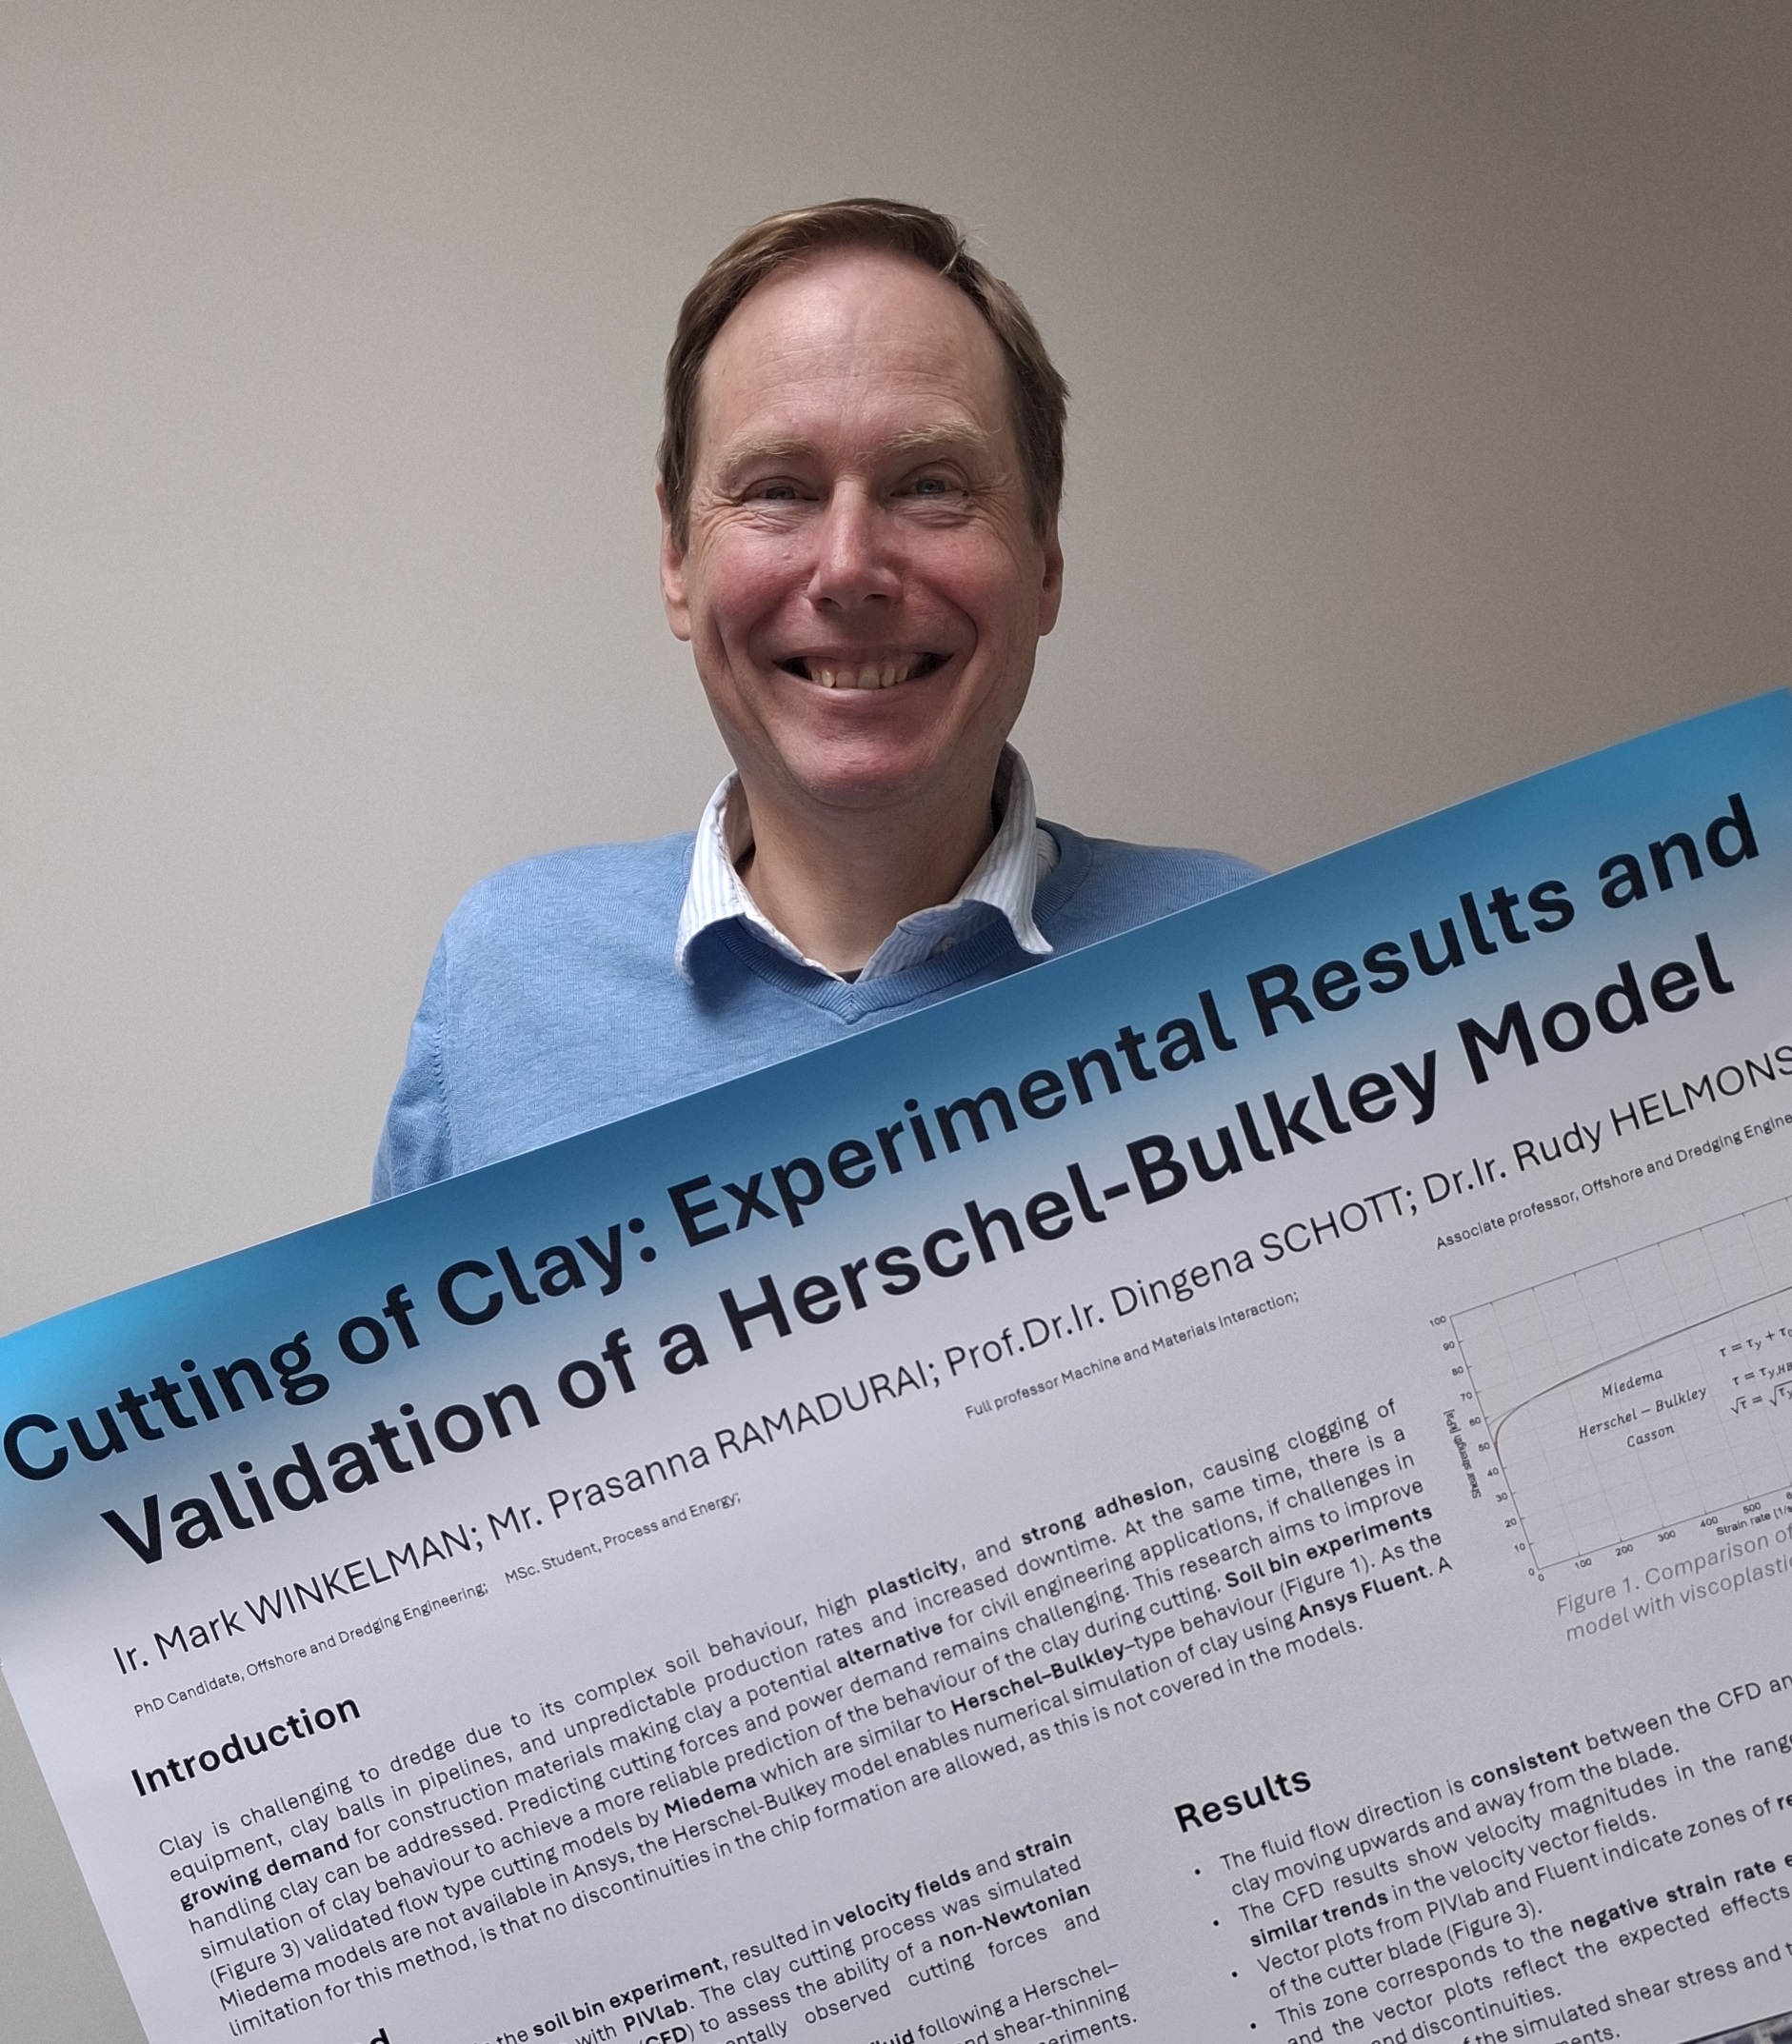
Recently, Luc Flake graduated on his bachelor project with us on the cutting of clay for my PhD research1. Anyone who has worked with clay cutting knows the challenge. Instead of breaking into manageable fragments, clay often behaves like a highly plastic material that flows continuously in front of the cutting tool. This flow-type behaviour can lead to cutterhead clogging, unpredictable production rates and increased cutting resistance. Unlike the research by Fabian Kruis who investigated the transition in cutting behaviour due to changes in operational parameters2, Luc was investigating the transitions due to the parameters of the soil itself.
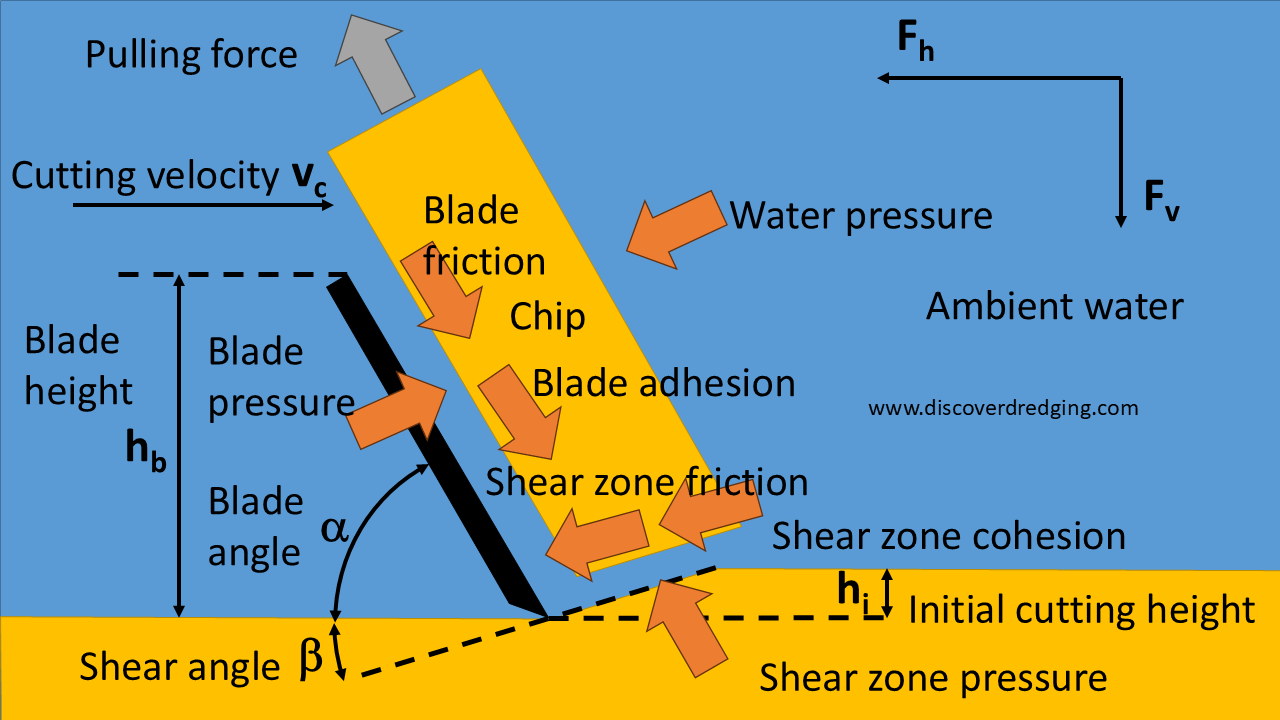
We previously found that the forces in the cutting process are influenced by more parameters than assumed in common clay cutting models. Especially the internal and external friction plays a role. Also, the adhesion not always has a fixed ratio to the cohesion. The result of these forces will change the normal forces in the shear plane. Under circumstances the normal force can change in direction. Instead of pushing on the plane, the chip will pull on the plane. Depending on the tensile strength of the clay, the shear plane will tear open and the cutting process transitions to the tear type. The internal angle of friction is a relatively known property of soil. Adhesion and external friction are usually not measured, but are relatively straightforward. The tensile strength of soil is a completely different animal.
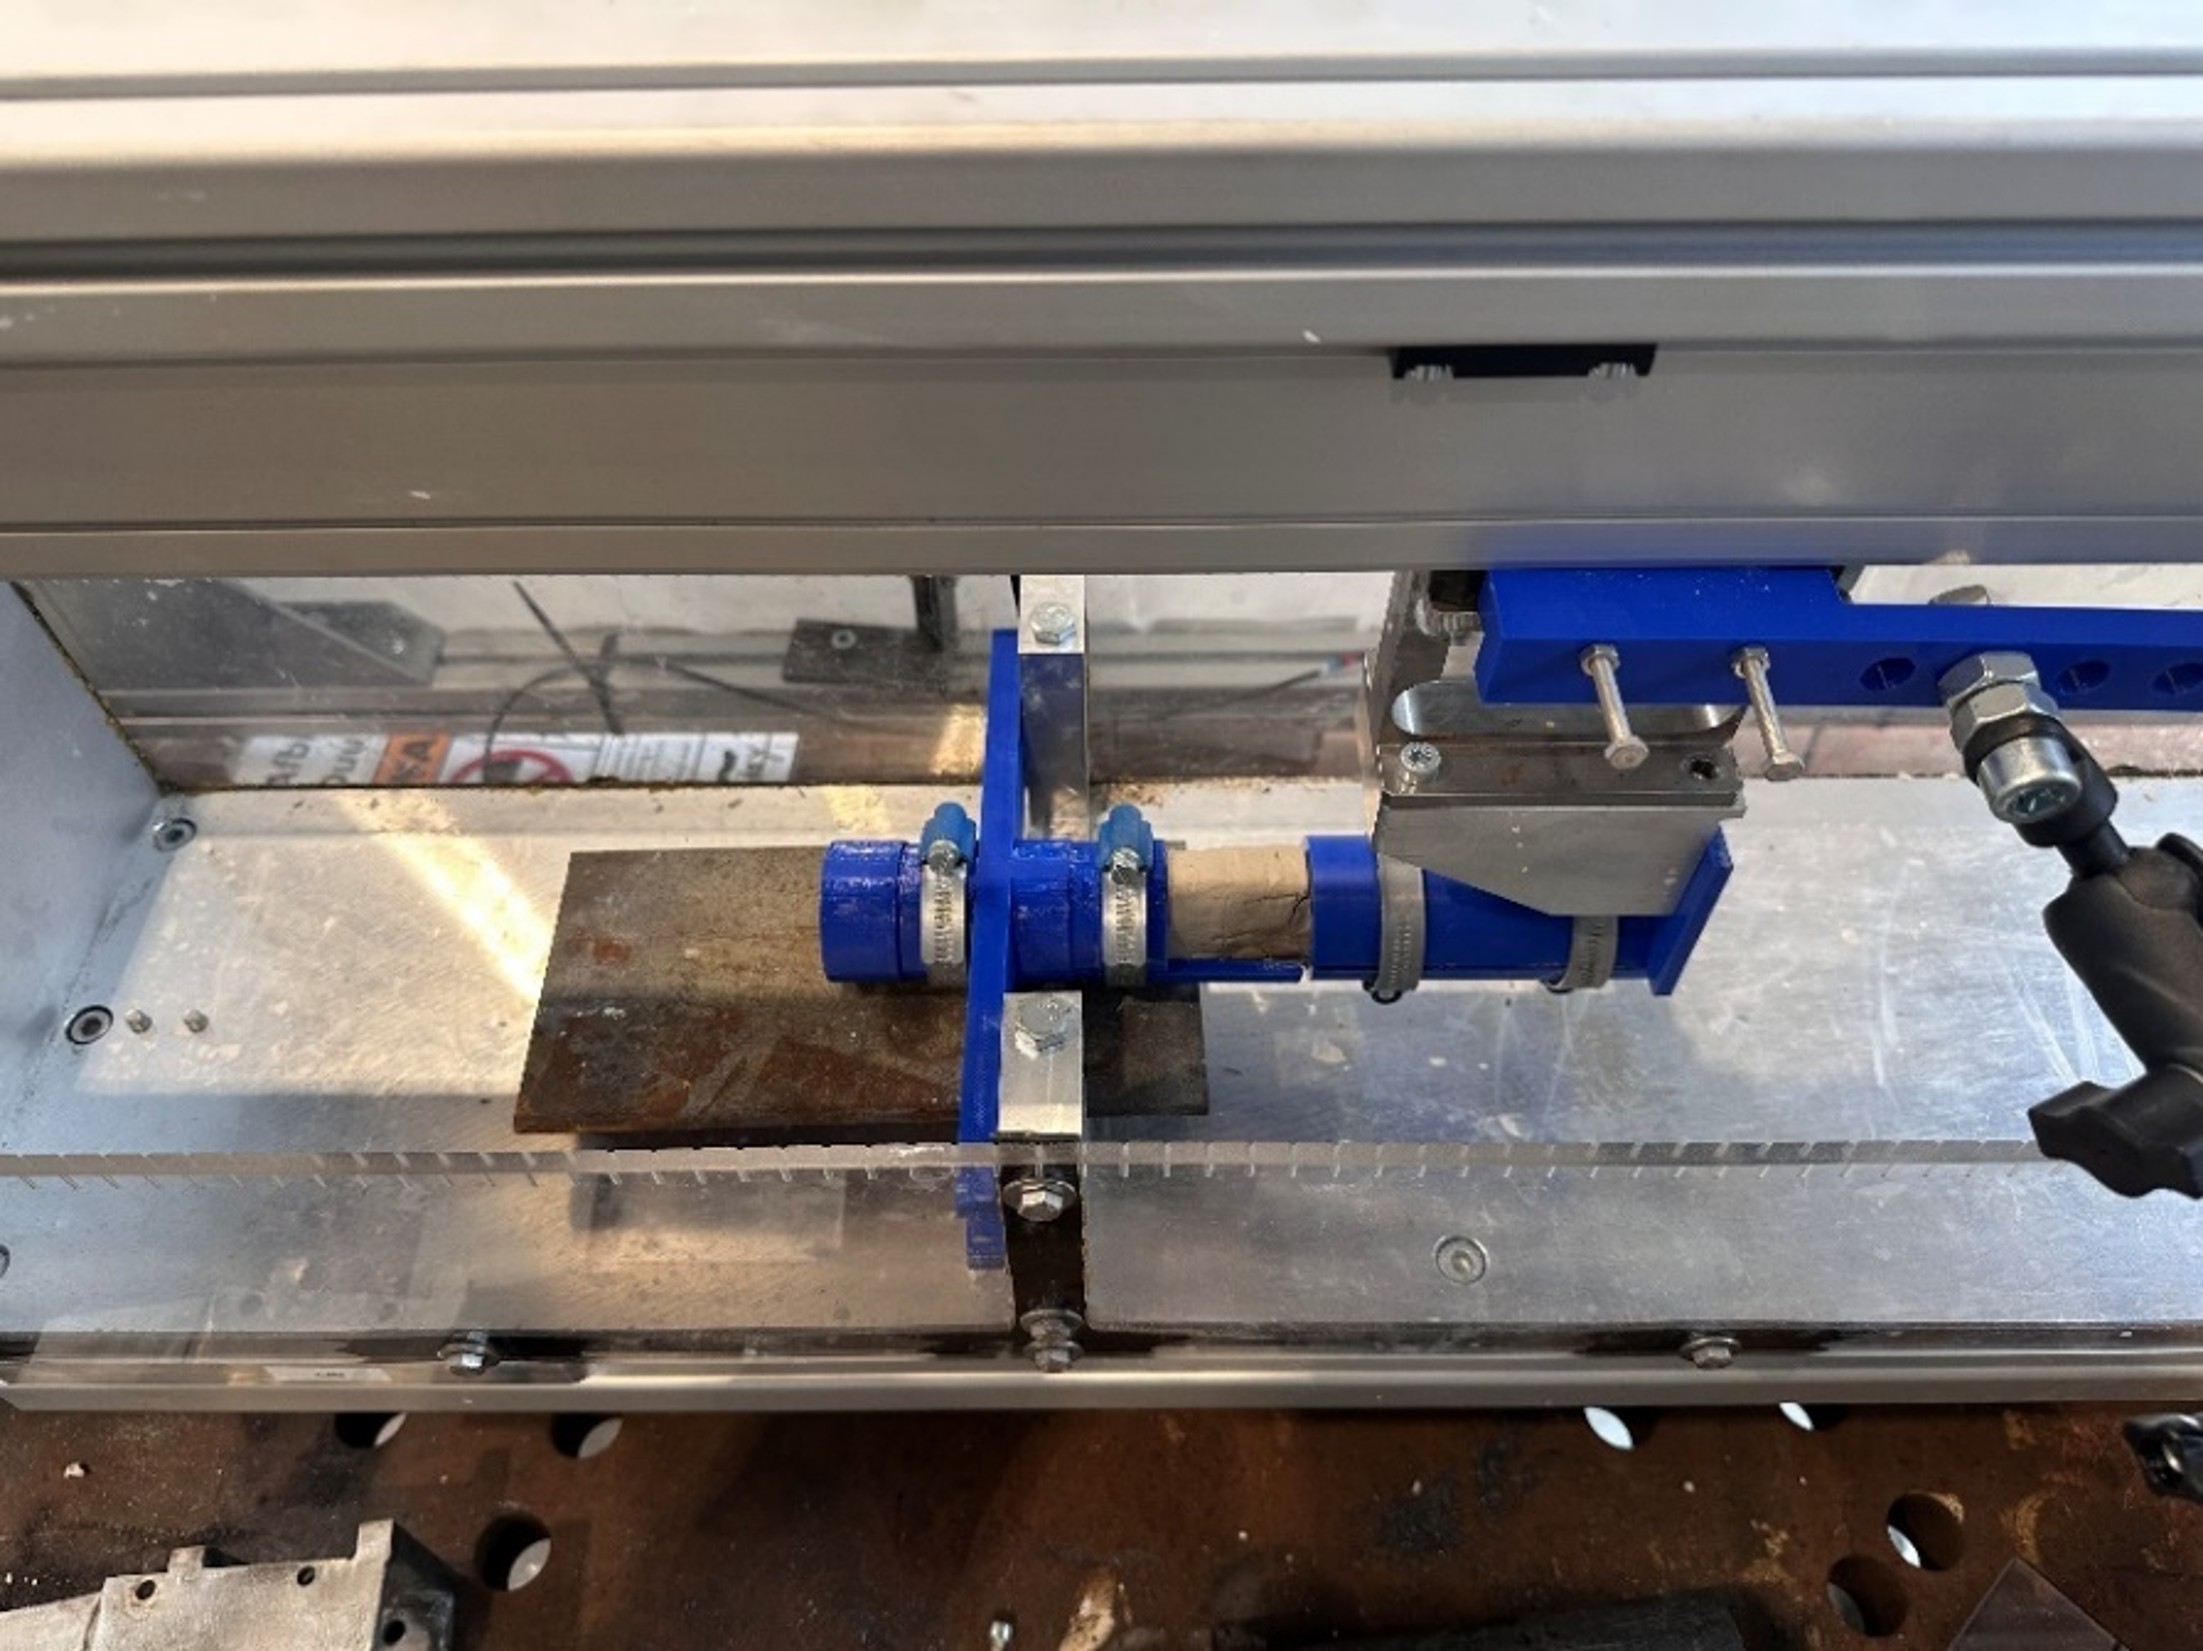
Proper civil engineers, like Luc nowadays, are used to putting things on top of other things. And gravity will provide for compressive stresses that keep the soil structure intact. We, as mechanical engineers, are more interested in destroying the structure and we are not afraid on pulling on materials. Civil engineers and mechanical engineers are even using different conventions for Mohr’s Circle. So, Luc had to devise a cunning plan to pull on the clay and find the tensile strength. He modified the test rig and had a special bracket printed to clamp the clay.

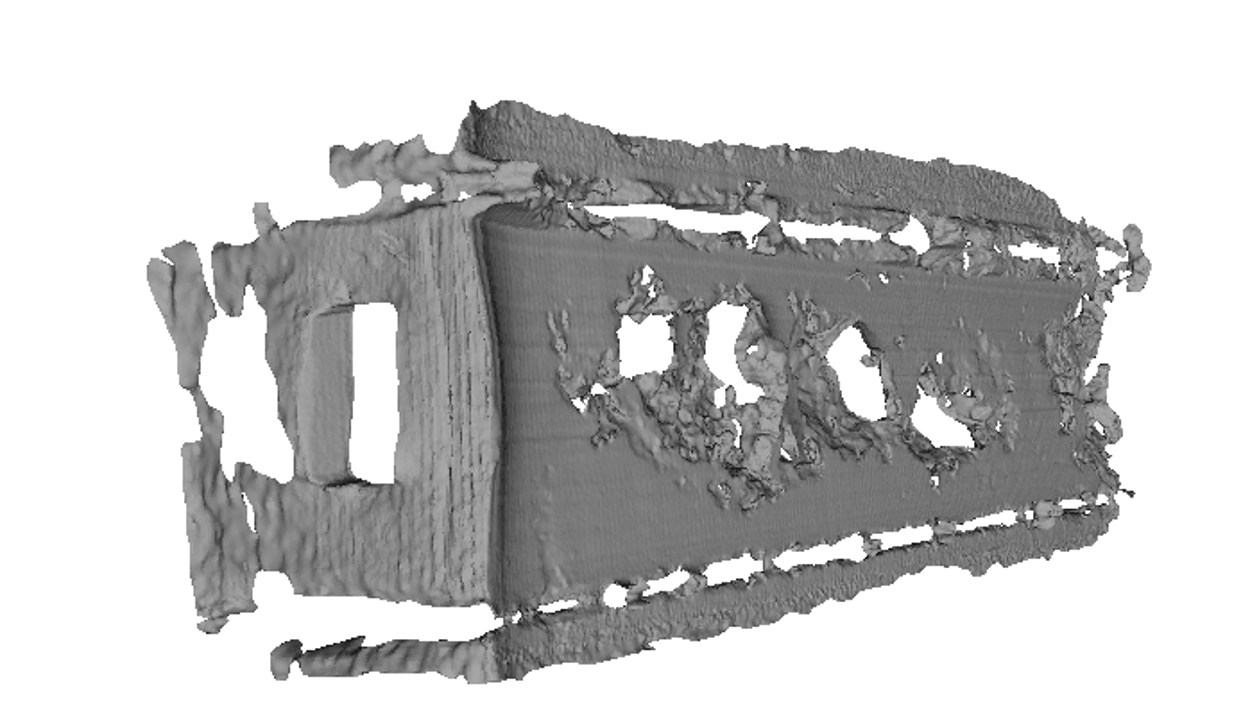
In order to modify the soil properties of clay, Luc gradually added sand and tuned the water content until the adhesion and the frictions reached the desired values. The resulting wet clay-sand mixture was consequently tested for tensile strength. As expected the tensile strength of the clay reduced as more sand was added. You can imagine that loose sand and no clay does not have any cohesive strength and consequently no tensile strength. Remarkably, there is a sand clay ratio that exhibits a slight local increase in tensile strength. Together with some other finds, we gained more insight in what we can expect of the different soils for the cutting process and how our dredges will perform in those conditions. Next to the usual test outputs, Luc also made some beautiful 3D scans of the resulting chips and block surface. These pictures are a very interesting for my research and will probably the topic of another post.
Luc, thank you for your contribution to my research project.