Ewout van Duursen 25 Years: Monitoring the Hopper Process

Ewout van Duursen (l) and colleague installing monitoring software on TSHD Tommy Norton

Regularly, I do write about the adventures of a student internship or graduation that I am involved in. And it really helps those young aspiring engineers to be in the limelight of attention. Today there is a different story on my website, the 25 year work anniversary of my esteemed colleague Ewout van Duursen1. A fitting opportunity to celebrate his achievements during his long career at Damen Dredging Equipment. Ewoud’s specialties are drive systems and programming. And especially in applications for trailing suction hopper dredges. One of the products he has been working on tirelessly are hopper process monitoring systems2.

Dredge master console with hopper process monitoring installed

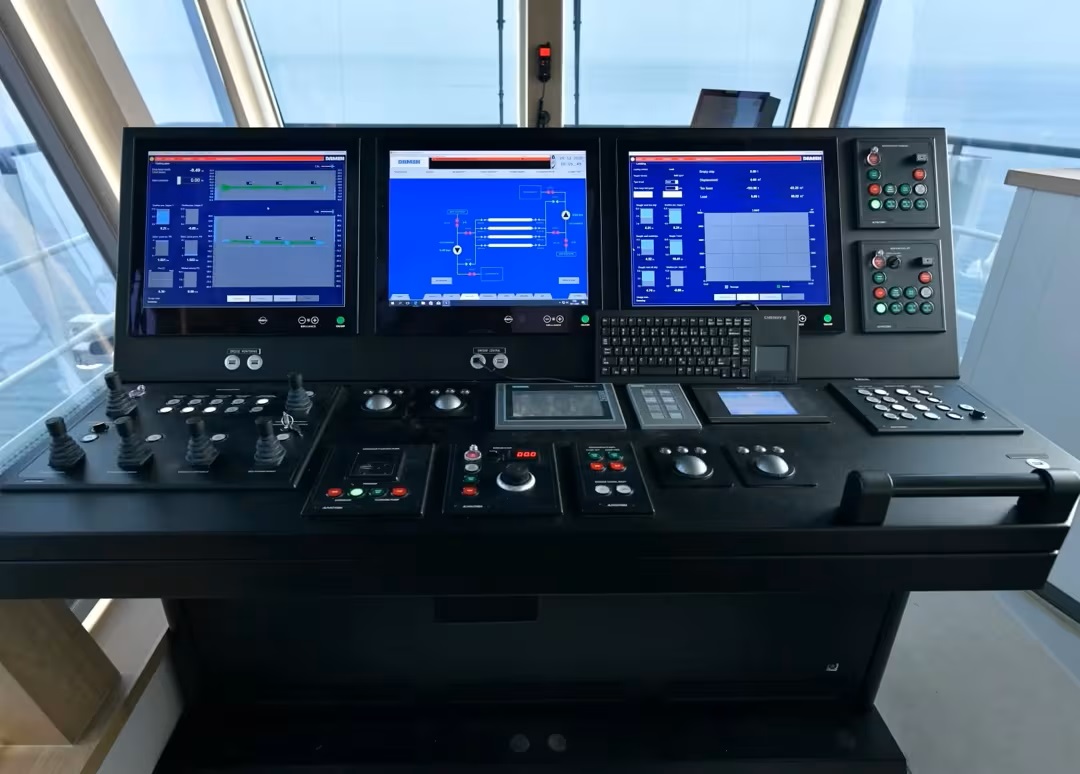
A good TSHD monitoring system will show a number of processes for operating a trailing suction hopper dredge.

  1. Trailing suction pipe visualisation
  2. Pump performance monitoring
  3. Hopper loading monitoring and draught measurement
  4. Survey and positioning
  5. Recording and reporting

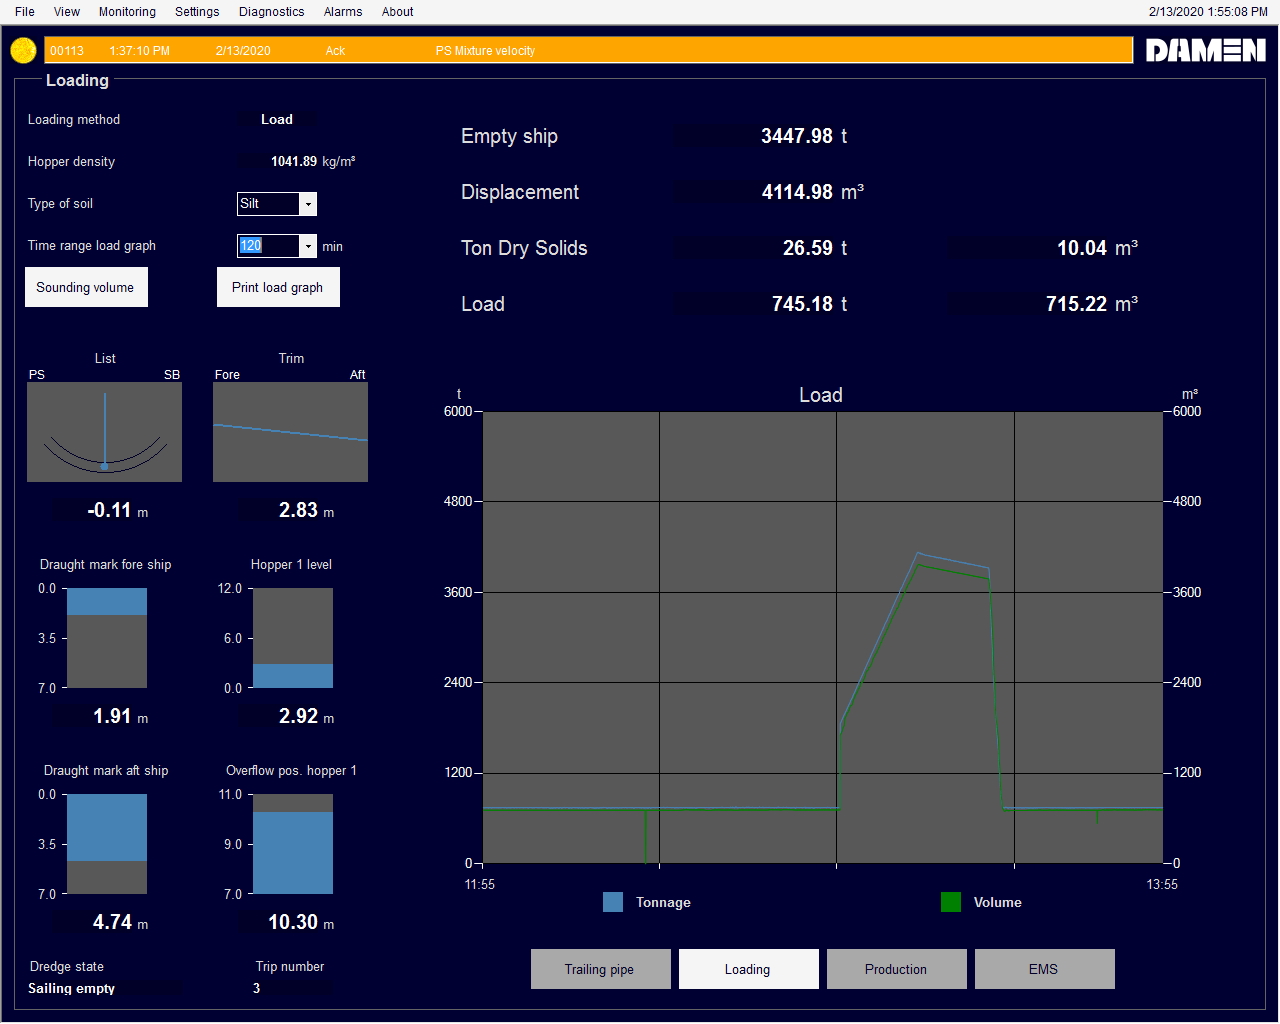
One aspect I want to highlight is the hopper loading and draught measurement. There are some details that might be confusing at first.

Screen shot of a sample hopper loading process

Take for instance a nominally 1000 cube hopper. It may be rectangular 32 m long, 9 m wide and 4 m deep, without any obstructions for simplicity. The mathematical capacity would be 1152 m³. But you don’t want to have the cargo spilling over the coaming. The maximum water level might be 0.5 m below the coaming making the volume 1008 m³. The maximum height of the telescopic overflow may be 0.7 m below the coaming level, as the water draws down about 0.2 m from stagnation level to the rim of the overflow. This measurable volume is now 950 m³.

Diagram of various hopper loading volumes

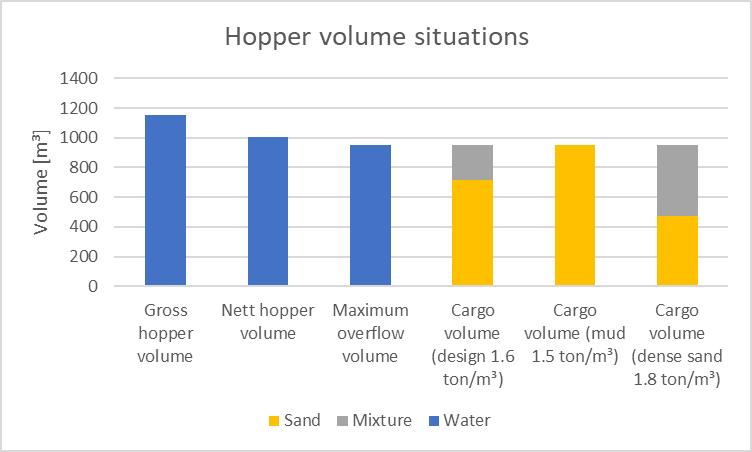
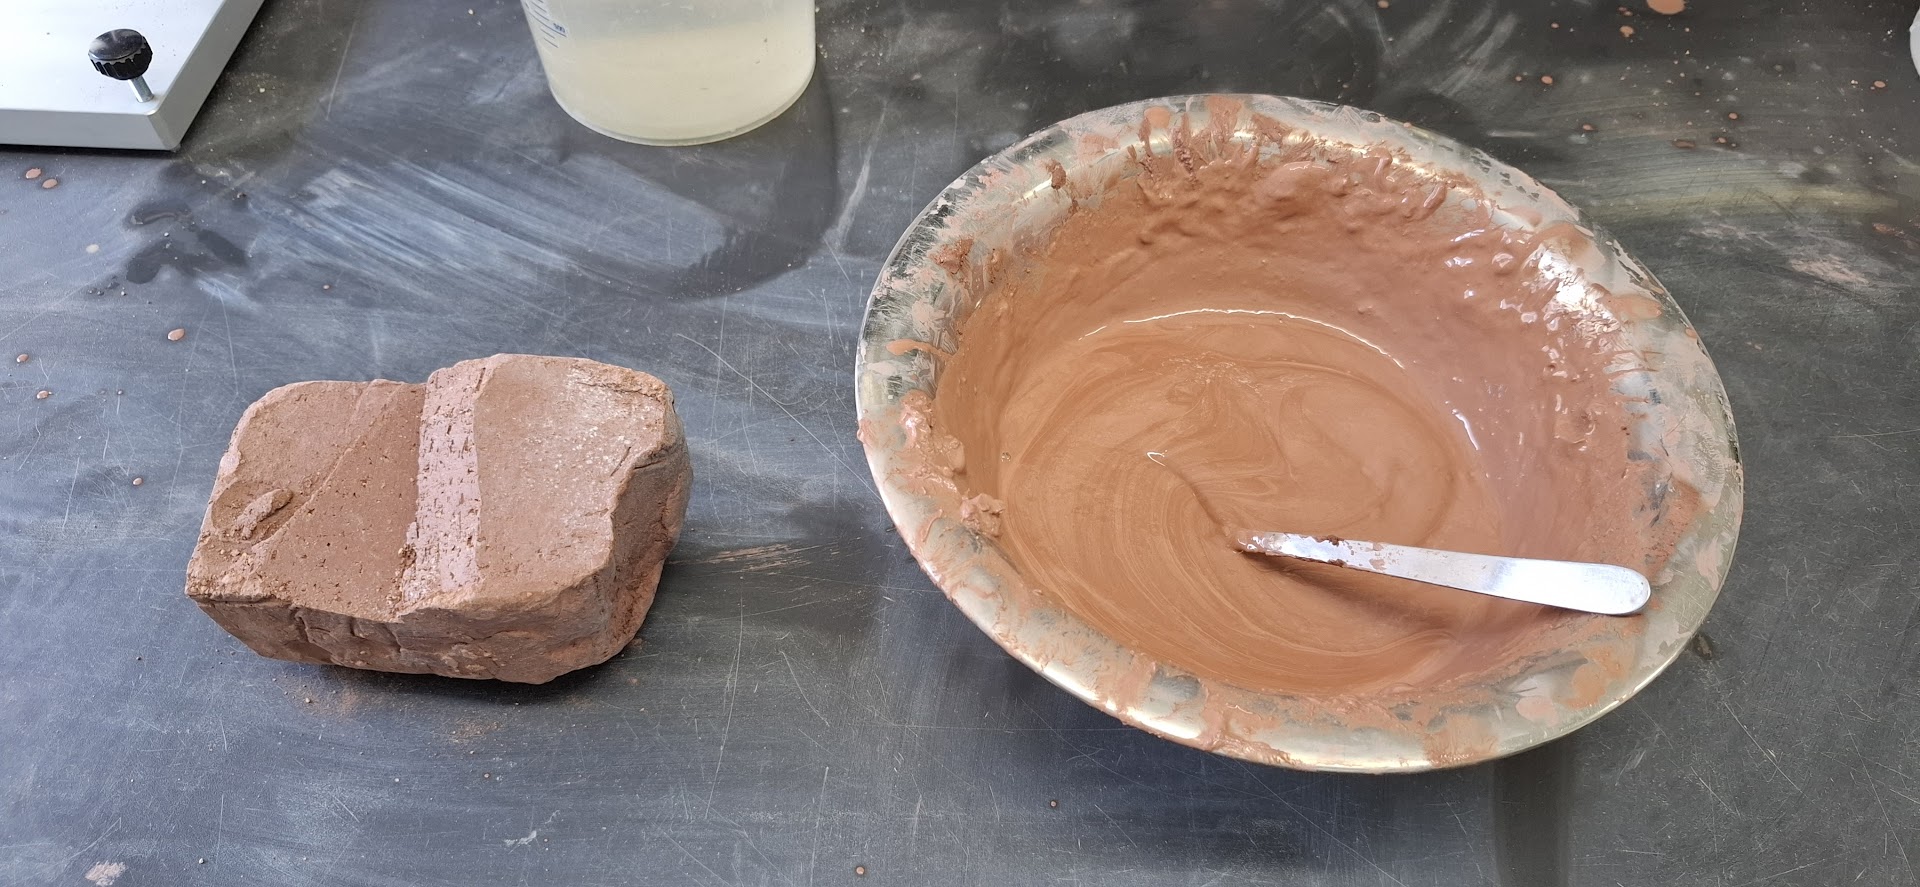
And the cargo does not only have volume, it also has a mass. And as Archimedes already discovered, mass displaces its weight in volume of water. During design of the vessel and the hopper, the loaded sand is assumed to have a certain density, e.g. 1.6 ton/m³. But the density for the hopper may only be 1.5 ton/m³, as one has to accommodate for the transport water that also enters the hopper. So, you can’t fill the 950 m³ with 1521 ton of sand. The vessel can only carry 1426 ton of total cargo. This is 713 m³ sand of 1.6 ton/m³ and 237 m³ mixture of 1.2 ton/m³. It sounds disappointing when your 1000 cube hopper only carries 713 m³ of valuable sand. The 1.5 ton/m³ hopper density is rather low and the vessel is probably more intended for silt and mud with a lower in situ density. With mud of 1.5 ton/m³ density, you can load the hopper to the rim. And when you encounter heavier sand with e.g. a density of 1.8 ton/m³, don’t try to fill the hopper with this 713 m³ mentioned before. You’ll sink your ship. A good hopper loading monitoring system will enable you to monitor filling of the hopper to the maximum safe cargo capacity.

Heavy weather dredging (Retrieved from YouTube 18/10/2012, unknown source)

References

  1. DDE celebrates 25 year anniversary of Ewout van Duursen, Linkedin
  2. Monitor your dredging process: Optimise your TSHD dredge cycle times, Damen

See also

Dredging equipment and technology – Chap2: Trailing suction hopper dredger, CEDA

Young CEDA Evening: the Grabbing History of Dredging

Presenting my lecture on the history of dredging at Young CEDA

Last Tuesday, I gave a presentation for Young CEDA1. The topic was to be about the history of dredging2. And I happily accepted the invitation to educate the younger generation into the tradition of our craft. I consider myself somewhere in between. Not part of the old generation, but past the younger generation. Though I am old enough to have heard the old guys talk about their history and their knowledge of where our modern industry came from. In particular those stories came from the lectures by professor Jan de Koning3 I attended as a student. He really was able to put a perspective on the origins of processes and technologies. Some of those stories have been recounted on my website already4. The oldest dredging project5, the oldest rock cutting technology6 and the oldest dredge canal7 still in use. They were all there at the presentation that evening.

Traditional dredge scoops for peat dredging and waterway maintenance (Credit: Wikipedia)

Here I would like to focus on another development presented that evening, but new on my website. A well known tool in the industry was the dredge scoop8. It has been used for ages, until even recently. However, the working depth is limited to the length of the stick. Longer would make it hard and impractical to use efficiently. In ancient Persia, there were three Banū Mūsā brothers9. Three scholars in 9th century Baghdad, who worked on astronomy, mathematics and engineering. Ahmad Banū Mūsā published ‘The Book of Ingenious Devices’10 which described a tool to pick things up from underwater, specifically oysters.

Oyster grab invented by Ahmed Banu Musa (Credit: 1001 Inventions)

Ahmed Banū Mūsā described in detail the phases in the cycle: lowering, closing, lifting and opening. And it already looks very familiar to the grabs we are using today in the dredging industry known as a clam shell grab. Modern versions are constructed from steel and hydraulically operated. The capacity is usually a couple of cubic meters. But there are designs of up to 200 cubic meters11. The advantage of grab cranes is their simplicity and employability. Whether sand, clay or rock, special versions can adapt a crane to the requirements of your project. The disadvantage is that they can be messy and it is a discontinuous process. Usually involving multiple barges, making them labour intensive. Still, with the right experience and man power, this is the tool of choice for many countries.

Closing process of a clam shell grab under water (Credit: Sape Miedema)

One of the most important phases is the closing process of the clam shell grab. Here are the limitations on the power and operating speed, that are the most important in the calculation of the cycle time and equipment capacity. Sape Miedema has proposed a model for this phase in the grab cycle12. The rest of the cycle is just adding up the operating times and multiplying by your number of cycles.
Sometimes the grab crane is placed on the barge itself to reduce the total investment and running costs. When looking for such a vessel, it can also be interesting to consider adding a trailing suction pipe or a DOP pump to make the vessel even more adaptable to the project requirements.

Damen clam shell grab crane hopper with a trailing suction pipe

References

  1. Young CEDA, CEDA
  2. Young CEDA, CEDA-BE & CEDA-NL Event, CEDA
  3. Tag: De Koning, Discover Dredging
  4. Category: History, Discover Dredging
  5. The Ancient History of the Cutter Suction Dredge ‘10th of Ramadan’, Discover Dredging
  6. Graduation Omar Karam: Rock Cutting The Egyptian Way, Discover Dredging
  7. Historical Origins Exhibition at the WODCON: the Beijing-Hangzhou Grand Canal, Discover Dredging
  8. Paying Tribute to the Hard Life of Peat Dredgers, Discover Dredging
  9. Banū Mūsā brothers, Wikipedia
  10. Book of Ingenious Devices, Wikipedia
  11. Tosho, DredgePoint
  12. The Closing Process of Clamshell Dredges in Water-Saturated Sand, WODCON

See also

Internship Prasanna Ramadurai: CFD Modelling Clay as a Fluid

Prasanna presenting his work at Damen Dredging Equipment

Prasanna Ramadurai has been doing an internship with us at Damen Dredging Equipment for my PhD project on the cutting of clay1. As an old fashioned analytical and experimental dinosaur, I have been working in my comfort zone. However, when submitting articles the response from the reviewers has been: ‘How about validating your results with a numerical simulation?’ And that is exactly what Prasanna has been doing for me these months. Now he has presented his work and I can use the results in my own research.

Relation of PI and CI to the adhesion range according to Atterberg

Clay is a strange material. It is neither a solid, nor a fluid. Depending on the amount of water in the material, it can behave like concrete or like water. The scale on which this can be described is defined by the Atterberg limits2. Well known soil parameters as Plasticity Index and Consistency Index are derived from those Atterberg limits. Atterberg himself defined the following limits:

ID Limit name Criteria
1 Upper liquid limit Starts to show signs of a viscous fluid
2 Lower liquid limit Normal Casagrande test or Fall cone test
3 Adhesion limit When no clay sticks to a nickel spatula
4 Upper plastic limit Can be moulded
5 Lower plastic limit Normal rolling test for plastic limit*
6 Cohesion limit When pieces of clay do not stick to each other anymore
7 Shrink limit Normal shrink limit, constant volume for water content
*Atterberg proposed to roll on a paper surface, whereas ISO 17892 proposes a glass plate

The consistency limits as originally proposed by Atterberg

The resistance of a material to deformation can be expressed as the resulting stress due to a strain rate. When there is immediate stress for even the slightest movement and constant after reaching a yield stress, this is typical of a solid. On the other hand, when a material starts to move immediately and the resistance to deformation increases with the strain rate, it is a fluid. And clay is just the typical material that exhibits both phenomena.

Shear stress models depending on strain rate

In rheology, the factor which shear stress is related to the increased strain rate is called viscosity3. However, due to the internal friction in clay, the stress follows the vertical axis and consequently, the viscosity becomes infinite. Prasanna squeezed out the capabilities of the CFD program using some clever mathematical tricks of a Herschel-Bulkley fluid model to get the simulation to behave. And the results are promising enough to follow up in a separate study.

Compare CFD simulation and PIV experiments

For supervising Prasanna, I am very grateful for the assistance of Suman Sapkota for his knowledge of computational fluid dynamics. Together with my knowledge of clay, Prasanna gained a very special set of skills in this area. Prasanna will be back at the TU Delft to continue his master’s graduation project. I can recommend him for having him in your team.

The same clay in solid and fluid form

References

  1. My PhD project posts, Discover Dredging
  2. Atterberg limits, Wikipedia
  3. Viscosity, Wikipedia

See also

Prasanna Ramadurai, LinkedIn